Chrome Dev Tools Debugging
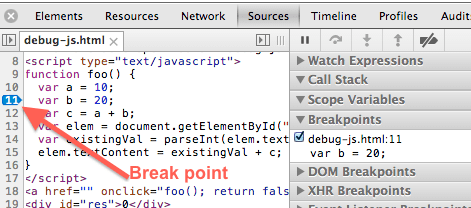
Using the chrome javascript debug tools we can see what the values of our loops are at any given time.
- open the chrome dev tools on your loops file
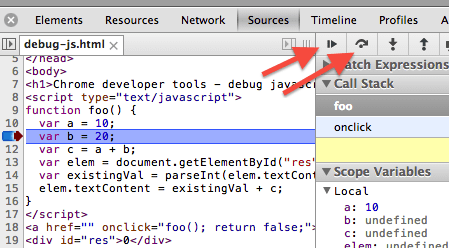
Chrome shows you where the currently executing line is

Use the stepping controls to advance one operation at a time

Chrome tells you the current value of the variables

Chrome tells you about any current errors in your program

You can instruct the browser to stop on any line with:
debugger;
Exercises
One of the most valuable tools you can use to figure out an error in a loop is to manually inspect values while the loop is running.
This can also simply help you learn what the mechanics of a loop are.
Run the debugger to see the values of each variable at each iteration of the loop.
Paste this code into your script.js
var num = 0;
var i =0;
while (i < 5){
  console.log("i is " + i);

  num = num + 13;
  num = num * 1.3;
  num = num / 2;
  console.log("num is " + num);

  i = i + 1;
}
Use the debugger so that you can know the exact values within a loop at a particular time:
- What is the value of
numwheniis 3? - What is the value of
numwheniis 4, and before num is divided by 2?
further
Go back to the previous loops exercises and run the debugger on them.
Use the breakpoint functionality to see what the values are at each step.